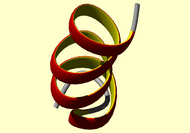
NMR Restraints Grid

 |
NMR Restraints Grid |
 |
Result table
| image | mrblock_id | pdb_id | bmrb_id | cing | stage | position | program | type |
|
|
555038 |
2lx4 |
18658 | cing | 1-original | 3 | DYANA/DIANA | unknown |
# ------ read input files ------

read upl a2n01.upl   # read upper distance bounds
read aco a2n01.aco   # read dihedral angle restraints


# ------ structure calculation ------

calc_all 20 steps=5000   # calculate conformers


# ------ structure calculation ------

overview demo.ovw structures=20 pdb # write overview file and 20 best conformers
# Copyright (c) 2002-05 Peter Guntert. All rights reserved.
## 7MACROS: caliba - CYANA macro
##
## Parameters: dmin=dmin                 (default: 2.4)
##             dmax=dmax                 (default: 5.5)
##             vmin=Vmin                 (default: 0.0)
##             bb=A                      (default: calculated automatically)
##             sc=B                      (default: A/dmin2)
##             methyl=C                  (default: B/3)
##             weight=w                  (default: 1.0)
##             avedis=d                  (default: 3.4)
##             plot=file                 (required)
##
## Calibrates a peak list, i.e. derives upper limit distance constraints from
## all assigned peaks and adds them to the list of current distance
## constraints. The values dmin and dmax give the minimal and the maximal
## value in A for a distance constraints before possible pseudo atom
## corrections are added. Optionally, only peaks with volume larger than Vmin
## or from a peak list with given filename (without extension) may be
## considered. Peaks are classified into three calibration classes:
## class        peaks/constraints       function
## backbone     all  HN/Ha - HN/Ha, and  HN/Ha - Hb between residues (i, j) with
## |i - j| < 5  V = A/d6
## sidechain    not "backbone" and not "methyl" V = B/d4
## methyl       all involving methyl groups     V = C/d4
##
## The parameters A, B and C are either given by the user or calculated
## automatically as follows:
## The function calsca is used to calculate A by assuming an average distance
## of d A for all constraints from the class "backbone". By default, the
## scalar B is set to B = A/dmin2 in order to intersect the backbone
## calibration curve at dmin, and C is set to B/3 (see also Mumenthaler et
## al., 1997).
## Optionally, the resulting distance constraints may be given the relative
## weight w. Also optionally, a logarithmic plot of volumes versus
## corresponding minimal distances in the selected structures can be
## created.

var echo plt f

syntax dmin=@r=2.4 dmax=@r=5.5 vmin=@r=100.0 bb=@r=-1.0 sc=@r=-1.0 \
       methyl=@r=-1.0 weight=@r=1.0 avedis=@r=3.4 plot=@f.ps=

echo:=off
plt='$plot'.ne.' '

print
print "    Calibration class: backbone"
print
peaks select "H HN HA* HB* QA QB - METHYL, H HN HA* QA - METHYL levels=0..4" info=none
peaks select "+ H HN HA* QA      - METHYL, H HN HA* QA - METHYL levels=5.." info=none
peaks select "/ *,*"
f:=1/d**6
if (bb.le.0.0) bb=calscale('$f',avedis,vmin)
print "    Calibration function: $bb(1PE10.2) * $f"
calibrate bb*$f $dmin $dmax weight=$weight \
          plot=$if(plt,'caliba_bb.grf',' ') log dmin qfactor

print
print "    Calibration class: side-chain"
print
peaks select "! - METHYL, *"
peaks select "/ *, *"
f:=1/d**4
if (sc.le.0.0) sc=bb/(dmin)**2
print "    Calibration function: $sc(1PE10.2) * $f"
calibrate sc*$f $dmin $dmax weight=$weight \
          plot=$if(plt,'caliba_sc.grf',' ') log dmin qfactor

print
print "    Calibration class: methyl"
print
peaks select "METHYL ,*" info=none
peaks select "/ *, *"
f:=1/d**4
if (methyl.le.0.0) methyl=sc/3.0
print "    Calibration function: $methyl(1PE10.2) * $f"
calibrate methyl*$f $dmin $dmax weight=$weight \
          plot=$if(plt,'caliba_me.grf',' ') log dmin qfactor
print

if (plt) then
  print "x0=-160 y0=150 x1=210 y1=350"     >$plot(1:indexr('$plot','.'))grf
  print "marksize=4"                       >>
  print file=caliba_bb.grf                 >>
  print " "                                >>
  print "x0=-160 y0=-100 x1=210 y1=100"    >>
  print file=caliba_sc.grf                 >>
  print " "                                >>
  print "x0=-160 y0=-350 x1=210 y1=-150"   >>
  print file=caliba_me.grf                 >>
  print " "                                >>
  print "X0=0 X1=100 Y0=0 Y1=100 "         >>
  print "x0=-250 x1=250 y0=-350 y1=350 "   >>
  print "clip off "                        >>
  print "rotate=on "                       >>
  print "textsize=14 "                     >>
  print "weight=bold "                     >>
  print "text 6 78 \"Backbone class\" "    >>
  print "text 6 42 \"Side-chain class\" "  >>
  print "text 6 5 \"Methyl group class\" " >>
  print "rotate=off "                      >>.
  graf $plot replace
  remove caliba_bb.grf caliba_sc.grf caliba_me.grf
end if
MET
GLY
SER
LEU
PHE
ARG
SER
GLU
SER
MET
CYS
LEU
ALA
GLN
LEU
PHE
LEU
Contact the webmaster for help, if required. Thursday, April 25, 2024 8:47:11 PM GMT (wattos1)